December Math Task
December Rich Math Task
This activity will allow students of all abilities to engage, collaborate, problem solve and contribute toward deeper mathematical understanding of dimensional mathematics while engaging in a hands-on and rigorous task.
Background:
This activity comes from the National Math and Science Foundation and involves hands-on experimentation to help students better understand surface area, volume, nets, ratios and proportions.
Grade Level:
This activity is designed for 6th and 7th grade students, but can easily be scaffolded for upper elementary students.
Objectives:
- Determine the surface area and volume of an irregularly shaped object
- Draw front, side and top views of the object
- Create nets for various parts of the object
- Apply scale factors to the nets
- Build models with unit cubes and with cardstock nets
- Investigate the resulting effects on surface area and volume when dimensions of a shape change proportionally.
Description:
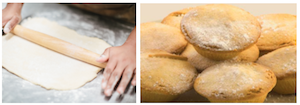
In this activity, students will explore the connections between linear measurements, area and volume of three dimensional objects. Students will create a “unit dog” out of connecting blocks and then discover what results when the dimensions of the unit dog are increased. Students will predict, discover and confirm connections between 1-dimensional measurements, 2-dimensional measurements and 3-dimensional measurements. Students will also have an opportunity to create nets from 3-dimensional objects and work with ratios/proportions while problem solving.
Mathematical Process Standards (Common Core):
MP3: Describe and justify mathematical understandings by constructing viable arguments, critiquing the reasoning of others and engaging in meaningful mathematics discourse
MP5: Use appropriate tools strategically.
MP8: Look for and express regularity in repeated reasoning.
Overview/Instructions:
The activity contains detailed teacher instructions as well as teaching strategies and notes to help teachers prepare for students struggles and scaffolding approaches. The activity also contains the student packets, the completed solutions and the printable grid paper to use during the activity.
This activity is extremely rich and flexible. The full activity could be done over multiple class periods or it can easily be scaled down to target specific standards in one class period.
Download the full activity description from NMSI as a PDF here.
April Math Task
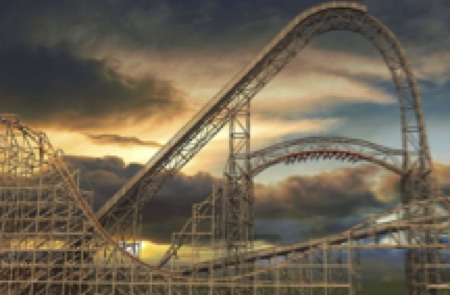
Best Roller Coaster: Wood vs. Steel
Standards
CCSS.MATH.CONTENT.6.SP.B.4 Display numerical data in plots on a number line, including dot plots, histograms, and box plots.
CCSS.MATH.CONTENT.6.SP.B.5.C Giving quantitative measures of center (median and/or mean) and variability (interquartile range and/or mean absolute deviation), as well as describing any overall pattern and any striking deviations from the overall pattern with reference to the context in which the data were gathered.
CCSS.MATH.CONTENT.7.SP.B.4 Use measures of center and measures of variability for numerical data from random samples to draw informal comparative inferences about two populations.
CCSS.MATH.CONTENT.7.SP.B.3
Informally assess the degree of visual overlap of two numerical data distributions with similar variabilities, measuring the difference between the centers by expressing it as a multiple of a measure of variability.
CCSS.MATH.PRACTICE.MP3 Construct viable arguments and critique the reasoning of others.
Introduction:
Introduce students to the overall debate: wood vs. steel roller coasters…which one is better? To motivate the discussion, show students pictures or video (for example: https://www.youtube.com/watch?v=36XbsxVT1tw) of the two types of roller coasters.
Establish the parameters of the task: that students must make a case for either the wood or steel roller coaster, and they must back up their opinion with data.
Have an introductory discussion about possible data they could use to prove their case. Here are some ideas for discussion questions:
- )What types of variables (height, speed, length, number of twists, number of inversions, etc.) describing rollercoasters can be measured?
- )What type of data (qualitative/quantitative) would each of these variables produce?
- )What types of analysis tools (scatterplots, circle graphs, bar charts, box-and-whisker, dotplots) might be useful to prove your case?
Show them the categories of the data on different roller coasters that is available at the following website: https://www.statcrunch.com/app/index.php?dataid=1137903
Activity:
Depending on time, the teacher can alter this section as necessary.
Option 1: To allow students the most amount of autonomy, have students use the raw data to create their own graphs using online tools such as https://plot.ly/create/box-plot/.
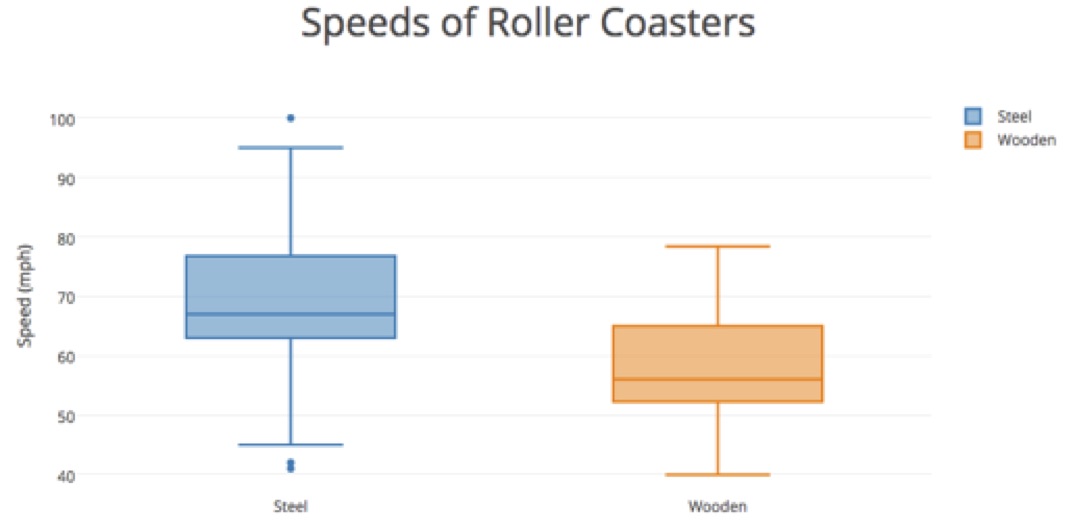
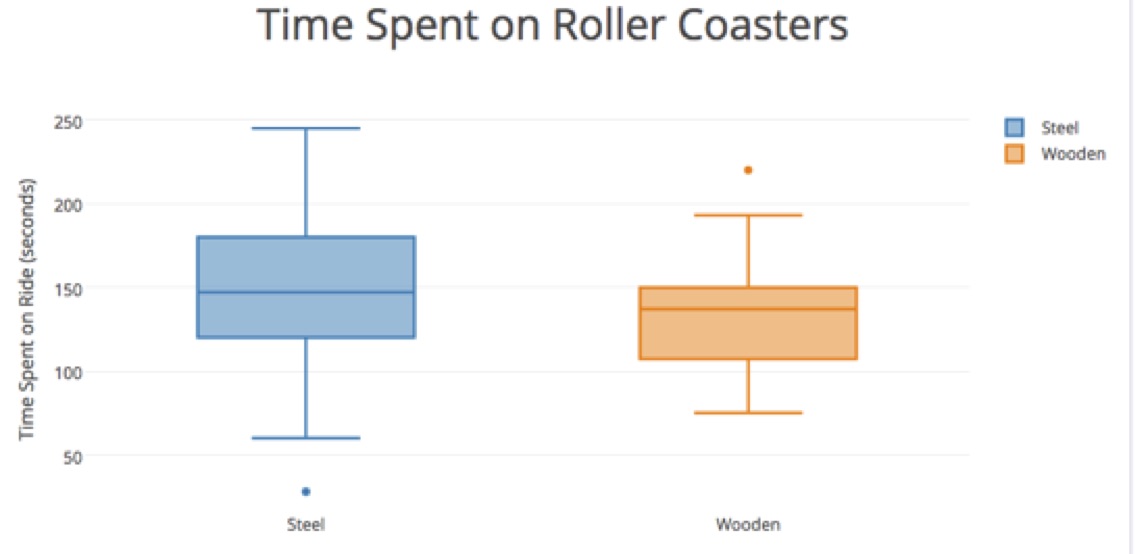
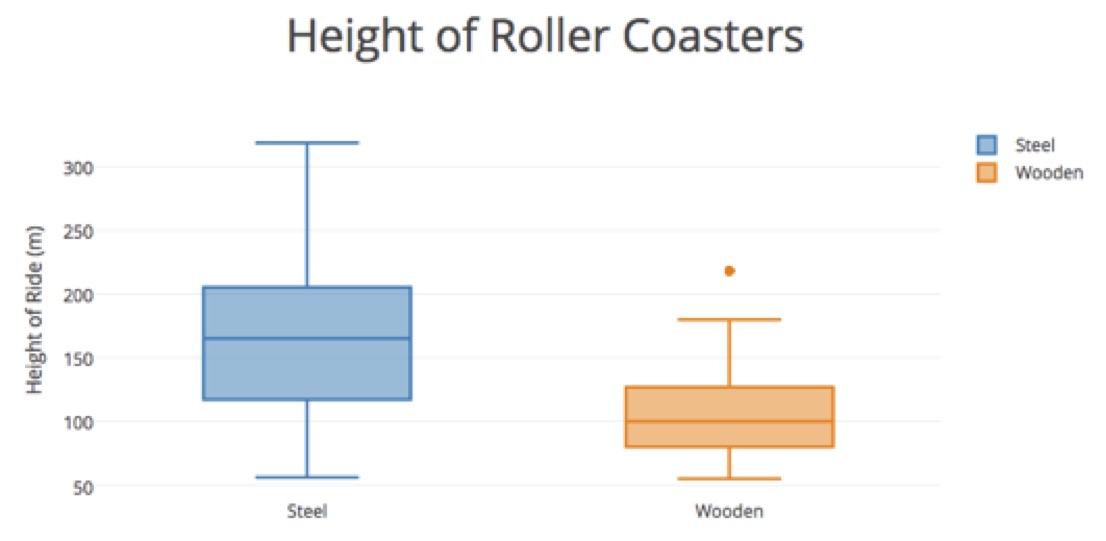
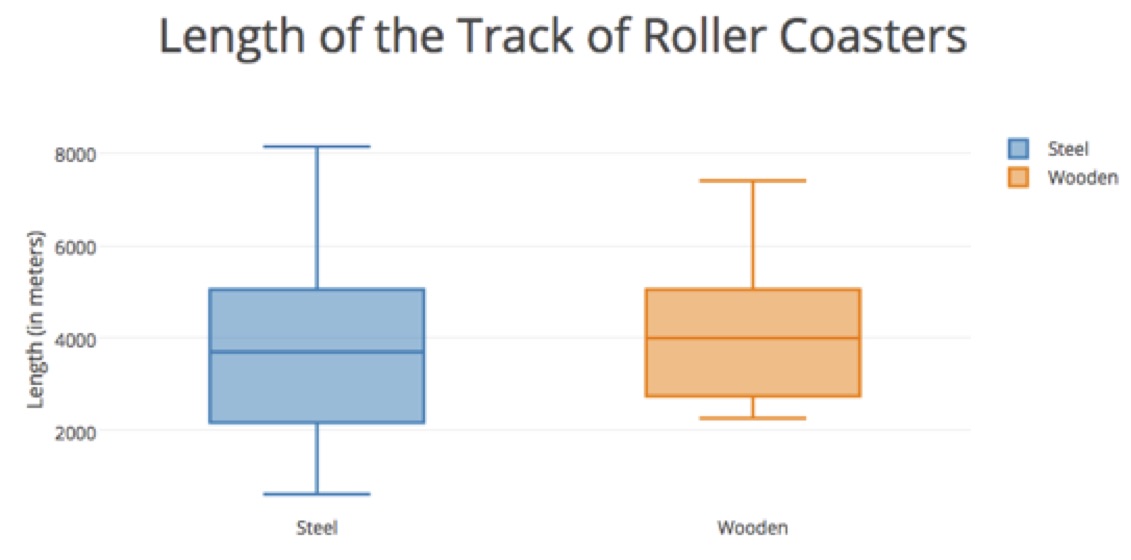
Option 2: If time doesn’t permit, then offer students the following graphs featuring four of the variables. Have students analyze the graphs and write explanations to argue their choice of the better type of rollercoaster. Remind students to be specific about the percentages of each type of roller coaster that fit a certain criteria.
After:
Discuss the analysis that students have produced as a class. Have students offer their arguments and try to convince their classmates. Consider some of the following questions to include in the discussion:
- What information does the data offer/not offer?
- How did the measures of center (median) affect your argument?
- How did the amount of variability (IQR) in the graphs affect your argument?
- How did you incorporate the outliers in your analysis?
Download this month's rich math task as a Word Document here.