Subscribe to our Newsletter   |       |    Contact Us

STEM pattern

STEM pattern

Rick Math Tasks

December Math Task

December Rich Math Task

Unit Dog

This activity will allow students of all abilities to engage, collaborate, problem solve and contribute toward deeper mathematical understanding of dimensional mathematics while engaging in a hands-on and rigorous task.

Background:

This activity comes from the National Math and Science Foundation and involves hands-on experimentation to help students better understand surface area, volume, nets, ratios and proportions.

Grade Level:

This activity is designed for 6th and 7th grade students, but can easily be scaffolded for upper elementary students.

Objectives:

  • Determine the surface area and volume of an irregularly shaped object
  • Draw front, side and top views of the object
  • Create nets for various parts of the object
  • Apply scale factors to the nets
  • Build models with unit cubes and with cardstock nets
  • Investigate the resulting effects on surface area and volume when dimensions of a shape change proportionally.

Description:

In this activity, students will explore the connections between linear measurements, area and volume of three dimensional objects.  Students will create a “unit dog” out of connecting blocks and then discover what results when the dimensions of the unit dog are increased.  Students will predict, discover and confirm connections between 1-dimensional measurements, 2-dimensional measurements and 3-dimensional measurements.  Students will also have an opportunity to create nets from 3-dimensional objects and work with ratios/proportions while problem solving.

Mathematical Process Standards (Common Core):

MP3:  Describe and justify mathematical understandings by constructing viable arguments, critiquing the reasoning of others and engaging in meaningful mathematics discourse

MP5: Use appropriate tools strategically.

MP8:  Look for and express regularity in repeated reasoning.

Overview/Instructions:

The activity contains detailed teacher instructions as well as teaching strategies and notes to help teachers prepare for students struggles and scaffolding approaches.  The activity also contains the student packets, the completed solutions and the printable grid paper to use during the activity.

This activity is extremely rich and flexible.  The full activity could be done over multiple class periods or it can easily be scaled down to target specific standards in one class period.

Download the full activity description from NMSI as a PDF here.


April Math Task

Best Roller Coaster:  Wood vs. Steel


 Apr Math 1Apr Math 2

Standards

CCSS.MATH.CONTENT.6.SP.B.4  Display numerical data in plots on a number line, including dot plots, histograms, and box plots.

CCSS.MATH.CONTENT.6.SP.B.5.C Giving quantitative measures of center (median and/or mean) and variability (interquartile range and/or mean absolute deviation), as well as describing any overall pattern and any striking deviations from the overall pattern with reference to the context in which the data were gathered.

CCSS.MATH.CONTENT.7.SP.B.4 Use measures of center and measures of variability for numerical data from random samples to draw informal comparative inferences about two populations.

CCSS.MATH.CONTENT.7.SP.B.3
Informally assess the degree of visual overlap of two numerical data distributions with similar variabilities, measuring the difference between the centers by expressing it as a multiple of a measure of variability.

CCSS.MATH.PRACTICE.MP3 Construct viable arguments and critique the reasoning of others.

CCSS.MATH.PRACTICE.MP5 Use appropriate tools strategically.


Introduction:

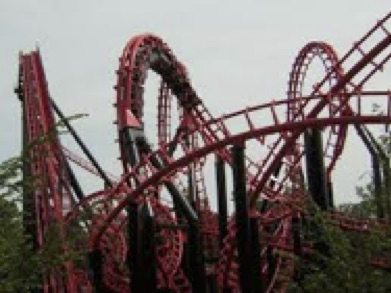
Introduce students to the overall debate: wood vs. steel roller coasters…which one is better?  To motivate the discussion, show students pictures or video (for example: https://www.youtube.com/watch?v=36XbsxVT1tw) of the two types of roller coasters.

Establish the parameters of the task: that students must make a case for either the wood or steel roller coaster, and they must back up their opinion with data. 

Have an introductory discussion about possible data they could use to prove their case.  Here are some ideas for discussion questions:

  1. )What types of variables (height, speed, length, number of twists, number of inversions, etc.) describing rollercoasters can be measured?
  2. )What type of data (qualitative/quantitative) would each of these variables produce?
  3. )What types of analysis tools (scatterplots, circle graphs, bar charts, box-and-whisker, dotplots) might be useful to prove your case?

Show them the categories of the data on different roller coasters that is available at the following website:  https://www.statcrunch.com/app/index.php?dataid=1137903

Activity: 

Depending on time, the teacher can alter this section as necessary. 

Option 1: To allow students the most amount of autonomy, have students use the raw data to create their own graphs using online tools such as https://plot.ly/create/box-plot/.

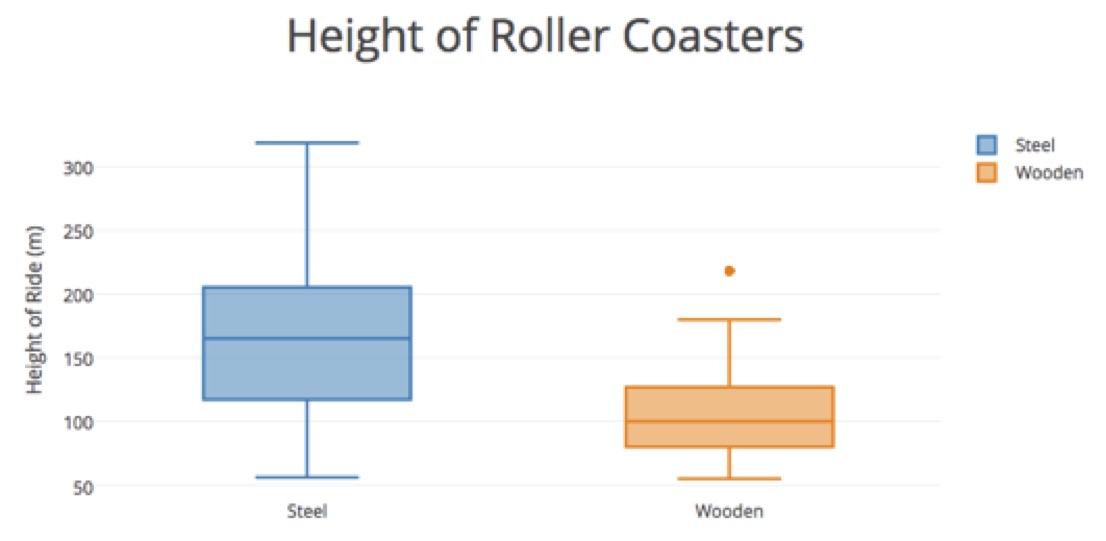
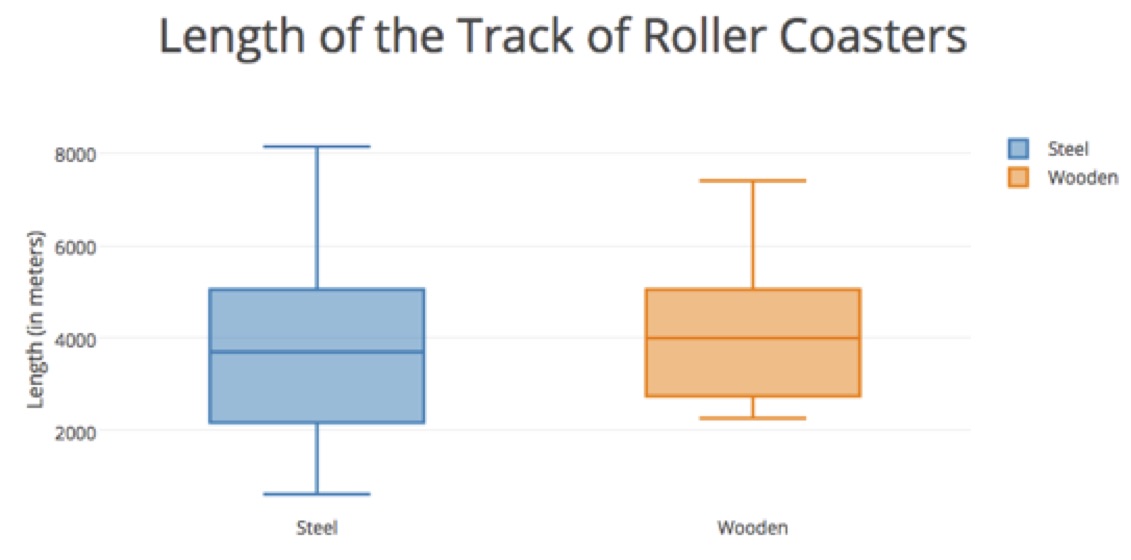
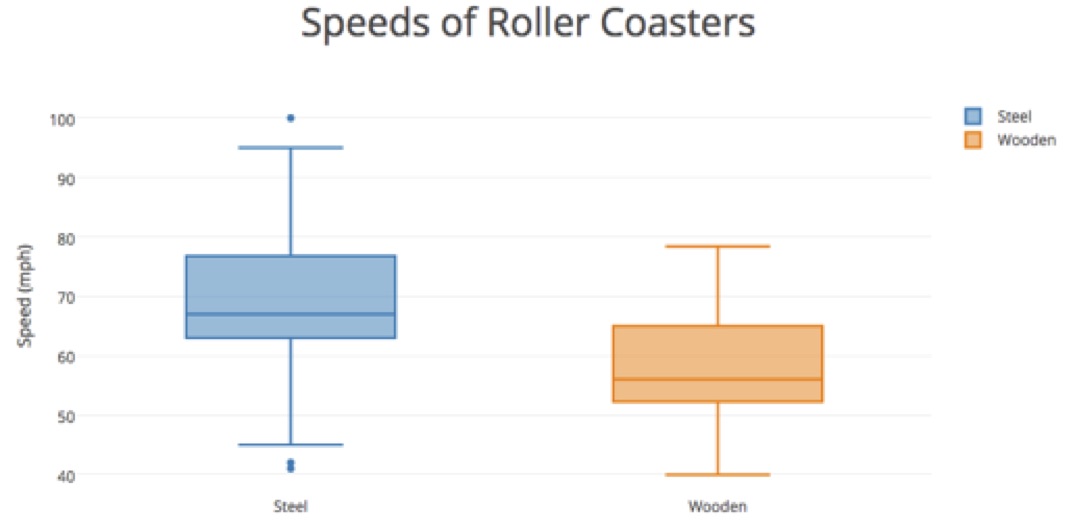
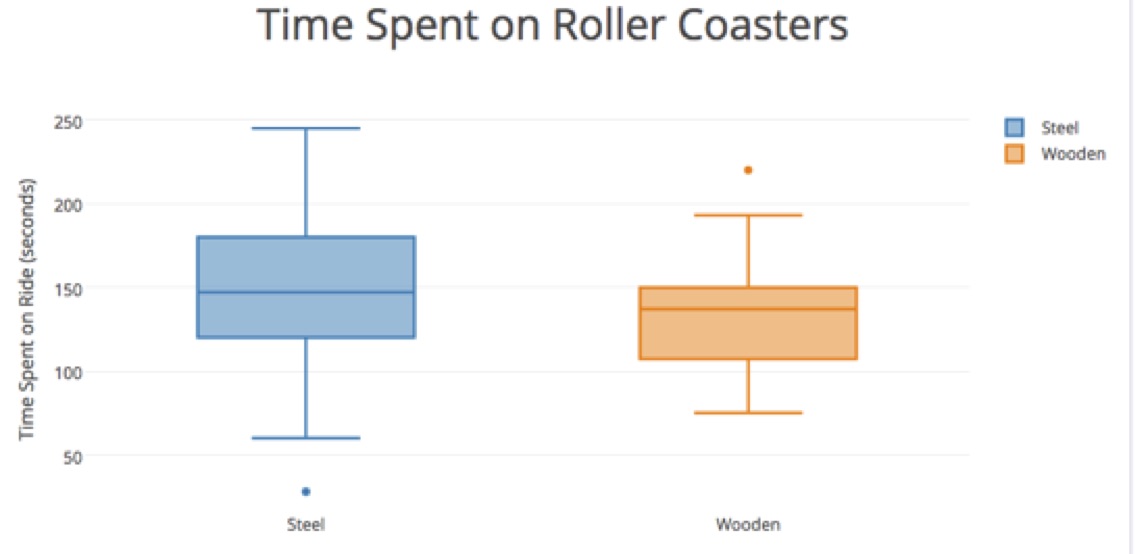
Option 2:  If time doesn’t permit, then offer students the following graphs featuring four of the variables.  Have students analyze the graphs and write explanations to argue their choice of the better type of rollercoaster.  Remind students to be specific about the percentages of each type of roller coaster that fit a certain criteria.
Apr Math 3

Apr Math 4

Apr Math 5

Apr Math 6

After:

Discuss the analysis that students have produced as a class.  Have students offer their arguments and try to convince their classmates.  Consider some of the following questions to include in the discussion:

  1. What information does the data offer/not offer?
  2. How did the measures of center (median) affect your argument?
  3. How did the amount of variability (IQR) in the graphs affect your argument?
  4. How did you incorporate the outliers in your analysis?

Download this month's rich math task as a Word Document here.

January/February Math Task

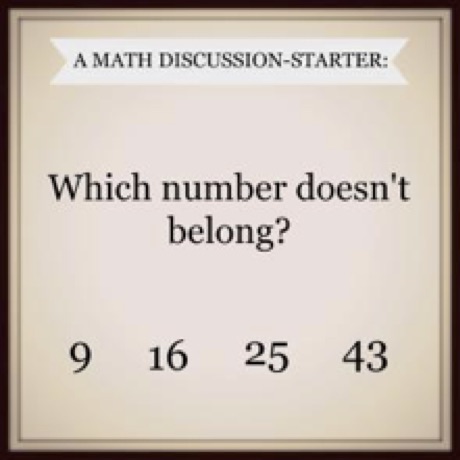
Which Number Does Not Belong?

Which One Doesnt Belong

Developed by Karen DeFilippis and adapted from Tyler Reed in Edu@scholastic.

Content Standards:

4.OA.B.4 Find all factor pairs for a whole number in the range 1-100. Recognize that a whole number is a multiple of each of its factors. Determine whether a given whole number in the range 1-100 is a multiple of a given one-digit number. Determine whether a given whole number in the range 1-100 is prime or composite.

Math Practices:

MP1 Make sense of problems and persevere in solving them.

MP2 Reason abstractly and quantitatively.

MP3 Construct viable arguments and critique the reasoning of others.

MP7. Look for and make use of structure.

Introduction

Teachers can use this problem to listen to the deeper mathematical thinking and reasoning of their students.  Students will be asked to apply their understanding of mathematics by justifying their conclusions and communicating those understandings to others.

Description/Teacher Instructions

Allow students time to make a case for each number not belonging to the group based on four different sets of criterion.  Then have students share their case with one another either in a Pair/Share setting or small group.  As students share their cases, the teacher should circulate the classroom while jotting down students’ names and ideas that will be later shared with the whole group. When discussions are complete, begin calling on students based on what you overheard while using some of the comments below when appropriate.

  • Thank you for sharing.
  • Please let me know if I’m not rephrasing you correctly. (I'm only rephrasing when I have trouble hearing the student.)
  • I want to make sure we’re writing down your thinking correctly, please slow down and tell us more about this step.
  • I’m not worried about the correct answer right now.  I’m just interested in how you thought about the problem.
  • Your sharing of how you arrived at the incorrect answer is really important — I think we learn a lot from our mistakes, and as you can see, you weren't the only one who thought about it that way.
  • Did you change your mind or question your strategy after you talk with your neighbor?
  • Who did the problem differently than the 3 people whom I called on to share?
  • I really appreciate how you questioned [and responded to] _____’s sharing.
  • I know it’s kind of tough to articulate your thinking. That’s okay. Take your time.
  • Math teachers sometimes get it wrong too.

Anticipated Answers

  • 43 - The other numbers can be reached by multiplying a number by itself. 3x3, 4x4, 5x5
  • I could say 9 is the number which doesn't belong. A simple reason would be "Because it only has one digit".
    • I think, in fact, 9 is the number doesn't belong, but for another reason: All the digits of 16, 25 and 43 sums to 7. 1+6 = 2+5 = 4+3 = 7.
  • 9 doesn't belong, because if you add up the digits in all of the other numbers, they give you 7. 9 is the only number that doesn't give you 7.
    1+6=7
    2+5=7
    4+3=7
  • I say 16 is the number that doesn't belong because 9, 25, and 43 are all odd numbers and 16 is even.
  • The number I first looked at was the number 16, because it is an even number and the other numbers are odd. But then I really digged deeper into these numbers and came up with the number 43 because the other numbers are square numbers and this made more sense. So depending on where the student is in Math would be how they look at these numbers.
  • I think number 25 doesn't belong. In each number, except 25, we can divide last number on 3. 9/3=3. 16 - 6/3=2. 43 - 3/3=1. And you also can see, that there is decreasing arithmetic progression
    • 25 doesn't belong because the product of the digits of all the numbers is a multiple of three; except 25.
    • 9 = 9
      1*6 = 6
      2*5 = 10
      4*3 = 12

Download this month's rich math task as a Word Document here.
May Math Task

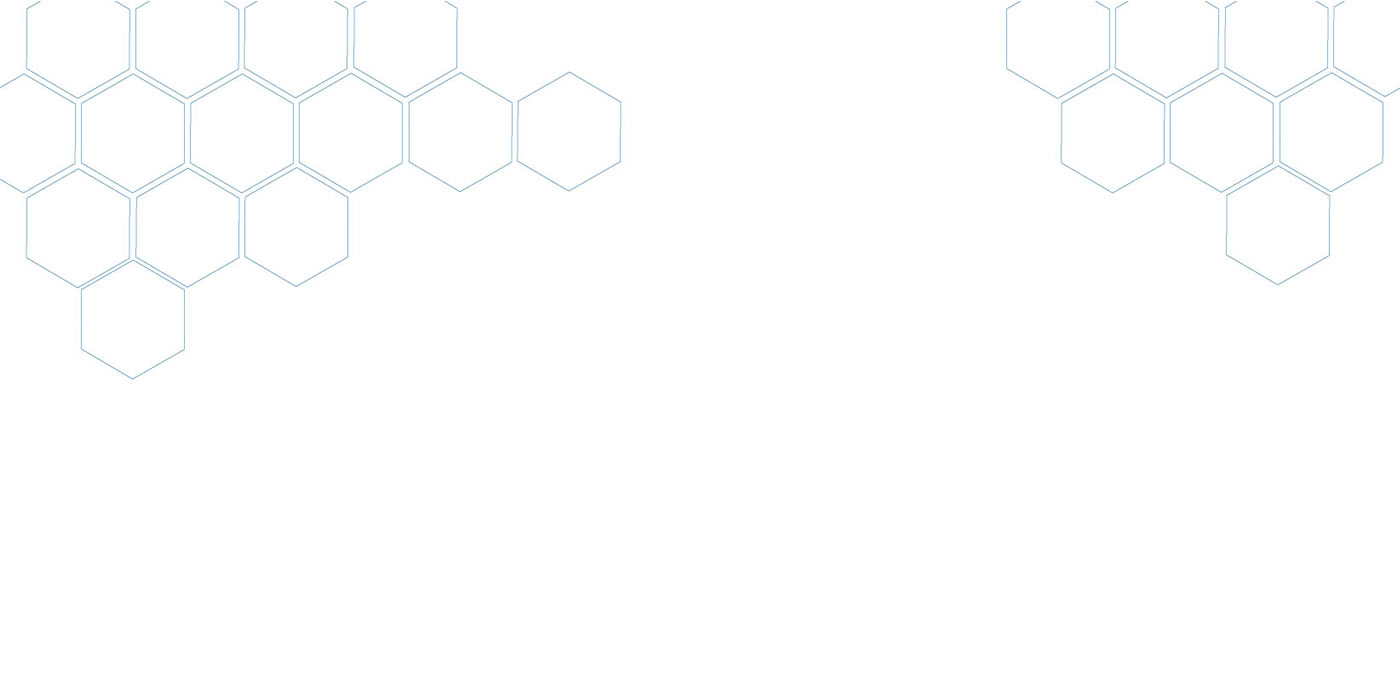
Don’t Waste Any Dough: Making Fruit Pie
(based off of Bowland Math’s Assessment Task “Fruit Pies”)

Screen Shot 2017 05 22 at 3.12.37 PM

Standards:

CCSS.MATH.CONTENT.7.G.B.4 Know the formulas for the area and circumference of a circle and use them to solve problems; give an informal derivation of the relationship between the circumference and area of a circle.
CCSS.MATH.PRACTICE.MP1 Make sense of problems and persevere in solving them. 
CCSS.MATH.PRACTICE.MP2 Reason abstractly and quantitatively.
CCSS.MATH.PRACTICE.MP4 Model with mathematics.

Introduction:

Introduce students to the process of making a mini-fruit pie and the constraints of the problem:

  • A complete pie requires two pastry circles: one with a 10 cm diameter, and one with a 6 cm diameter.

  • The dough begins as a rectangular sheet with the dimensions 60 cm by 30 cm.

  • After she cuts out the first set of circles, she balls up the leftover dough and rerolls it into a smaller rectangle (but she will only use the leftover pastry in this way once).

  • Note: because the dough is rolled so thin, the thickness of the dough will not be included in the calculations for the amount of remaining dough.

  • Task: Find the maximum amount of pies that can be made.

  • More details for this activity can be found at: http://www.bowlandmaths.org.uk/assessment/fruit_pies.html. This website has a powerpoint and a worksheet with pictures to illustrate this problem. 

  • Have an introductory discussion about possible strategies the students can use. Here are some ideas for discussion questions:

More details for this activity can be found at: http://www.bowlandmaths.org.uk/assessment/fruit_pies.html. This website has a powerpoint and a worksheet with pictures to illustrate this problem. 

Have an introductory discussion about possible strategies the students can use. Here are some ideas for discussion questions:

  1. Why are two sizes of circles required for the pie?

  2. Can all of the pastry be used in the first rolling? Explain how you know.

  3. How do the two sizes of circles affect how they can be laid out on the dough?

  4. What should be considered when rolling out the dough the second time?

  5. What are some different strategies that are possible when laying out the circles on the dough?

  6. How will you know whether you have found the maximum possible number of pies?

  7. How will you organize your work?

Activity:

Have students work on the task. Teachers can informally check work with the following values:

  • Area of dough at beginning: 1800??!

  • Area of small circle: 9? 28.27??!

  • Area of large circle: 25? 78.54??!

    After:

    Discuss the calculations and conclusions that students have produced. Have students explain their work and try to convince their classmates that their way is most efficient and/or effective. Consider some of the following questions to include in the discussion:

  1. How did you lay out the circles for the first rolling of the dough?

  2. How did you lay out the circles for the second rolling of the dough?

  3. How did the layout of the circles in the first rolling affect the results of the dough in the second rolling?

  4. Did anyone try a strategy that left a lot of leftover dough? Why do you think that it left so much?

  5. Extension: Without changing the amount of dough, how might you try changing the problem in order

    to increase the number of pies? 

Download this month's rich math task as a PDF here.

Join the Notre Dame STEM Teaching Fellows